Political Polling Part 4: The Tricky Stuff
This post is part of a series on political polling. To start at the beginning, click here. The code used to generate the charts in this post can be found here and here.
A big problem, possibly the biggest problem in political polling, is that you can’t guarantee what demographics will be correlated with the candidates, or how voters will turn out at the ballot box or even pick up the phone to respond to a poll.
For example, one of the likely reasons 2016 presidential polls were off in several key states was the increase in correlation between candidate preference and education. This change, coupled with a longstanding trend of more educated voters being more likely to respond to polls, led to an overestimate of Hilary Clinton’s victory chances. More recently, early reads on Donald Trump’s 2020 overperformance in the midwest suggest it was increasing Trump support among people who are socially isolated1 and therefore uninterested in responding to polls.
To get a better sense of how this could happen, we can simulate an electorate similar to the midwest in 2016, where education and response rate are both correlated with candidate choice:
| Age Group | Education | Response Likelihood | Candidate Preference (Dem-Rep) |
|---|---|---|---|
| 18-30 | High School | 10% | 62%-38% |
| College | 50% | 75%-25% | |
| Postgraduate | 50% | 88%-12% | |
| 30-50 | High School | 10% | 32%-68% |
| College | 50% | 55%-45% | |
| Postgraduate | 50% | 78%-22% | |
| 50-65 | High School | 10% | 10%-90% |
| College | 50% | 40%-60% | |
| Postgraduate | 50% | 70%-30% | |
| 65+ | High School | 10% | 0%-100% |
| College | 50% | 25%-75% | |
| Postgraduate | 50% | 62%-38% |
We’ll leave turnout at 50% for every group: while in reality this would also be correlated with these demographics, keeping it constant makes the problem simpler to understand.
These demographics result in a small victory for the Republican candidate:
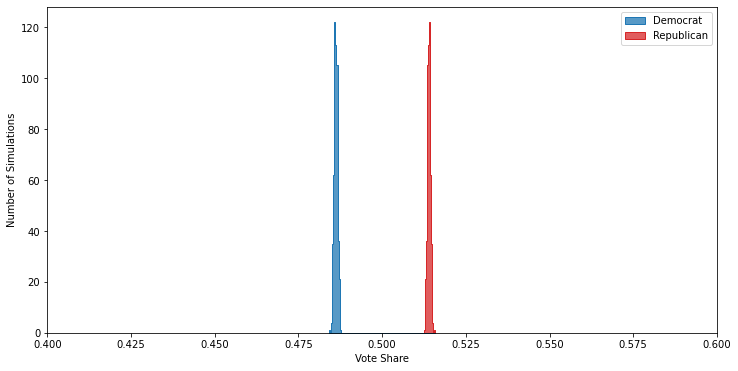
But, unlike in past posts, we’ll pretend that we don’t have an omniscient view of the important demographics and, like in 2016, we’ll ignore education. As promised, even after doing the demographic weighting discussed in the last post the results are still seriously off:
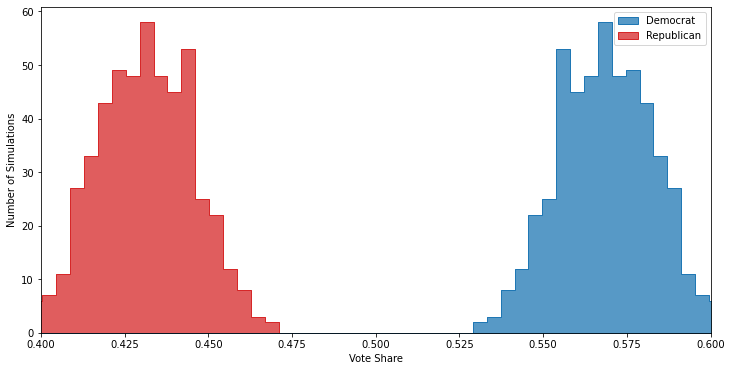
This poll overstates the Democratic vote-share by close to 10 points, and is so far off that if a campaign or PAC were to treat these results as accurate it would likely lead them to make bad decisions2.
How Can We Fix This?
Up to this point, I feel pretty confident that the techniques I’ve been describing in this series have been reasonably close to what pollsters are actually doing: in doing my research for this I found multiple explainers on high level strategies for handling response rates and turnout likelihood, and the ideas discussed so far are not so complicated or esoteric that it would be challenging for a pollster to implement them. From here, however, I’m flying pretty blind: I’m going to suggest a couple of things that I think would be helpful, but they depend more on the detailed operation of individual pollsters that aren’t generally shared publicly. Furthermore, I have very little idea about how novel they are — for all I know they are already in common use.
With those caveats out of the way, here they are:
1. Vary Survey Strategy
If pollsters make multiple polls of the same race, then generally seem to use the same polling strategy each time: the number of respondents is very similar poll-to-poll, as are the questions asked3. On the one had this is a good idea, as it makes the results between polls directly comparable to each other. But on the other hand if one of your polls has a faulty assumption, then that problem will propagate to all of your polls.
If carefully thought out, I believe occasionally varying your survey strategy would be a useful way to gain confidence that the assumptions you’re making are valid. Basically, if you have the “correct” view of the important factors influencing voting patterns, changing the details of your mehodology should produce approximately the same result. For example:
- A poll using a different contact method, e.g. if you’ve been calling respondents on the phone, try a poll done by mail instead.
- A poll where you vary the order of the questions, or only ask a subset of the questions, or even a poll where instead of only asking about politics you start by asking questions on a totally different topic.
- A mega-poll with triple the respondents, or one where you work much harder than normal to get your response rate up.
- A poll that offers a significant cash incentive for completion.
The downsides to changing methodologies is that it increases the chances for you to make a mistake in analyzing your data: there’s just more choices you’ll need to make in trying to figure out the results from a variety of polls. Varying polling types can also cost more, both in time spent building the new polls out but also in that they may cost more to execute (especially if you run a larger poll, or try harder to followup with respondents).
2. Check For Trends Against Unused Demographics
If you have additional demographic information about your poll respondents beyond what you use to weight for turnout and response rate, you can check the raw responses to see if candidate preference is correlated with any of the “extraneous” demographics. For instance, going back to the simulated example above, plotting candidate preference versus education would have shown a correlation, indicating that in future polls we should consider weighting by that demographic as well.
The challenges with this idea are twofold:
- There is a chance of a false correlation, especially if you try to correlate many different demographic segmentations with candidate preference. Therefore you would need to be very careful to ensure that you were actually finding a real electoral signal, rather than just getting lucky with random noise.
- Gathering lots of demographic information is difficult. Asking poll respondents about demographics costs money, and adding too many questions will bloat survey times and may lead to people giving up before completing the poll. In some cases it may be possible to link respondents to demographics separately from poll questions (e.g. pulling public-records data), but getting that data can be expensive and sometimes shady.
3. Include Data About Contacting Respondents
If your poll attempts to contact respondents multiple times, the data on how long it takes to get a response could be useful in and of itself. If there is a relationship between candidate preference and the number of contact attempts within a demographic group, then that indicates you probably can’t extrapolate the voting preferences of your poll respondents to the broader population. Here’s what that looks like in my simulations, looking at just the 30-50 year old age group when using 5 contact attempts:
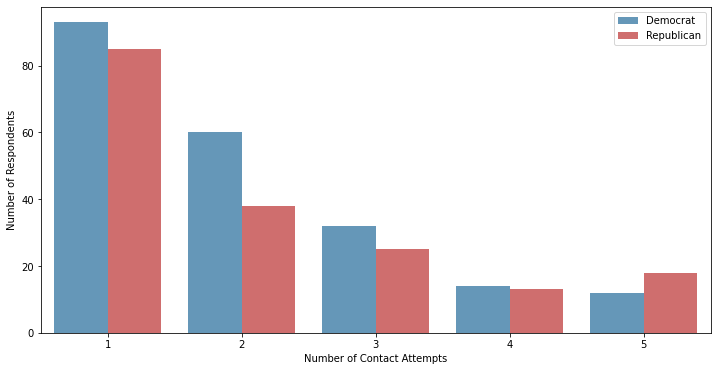
You can see how the candidate preference shifts from Democrat to Republican as you go from one to five contact attempts.
This approach depends on knowing how people react to multiple contact attempts: my simulator assumes that they have a flat chance of responding to a given contact attempt, but in reality that may not be the right model. Additionally, if there is a group of people who never respond to polls, there’s nothing this method will do to help you understand if their preferences meaningfully differ from the respondents.
Where Do Polls Go From Here?
Polling seems pretty straightforward on the surface — randomly mash the buttons on a phone and then ask whoever answers who they’re going to vote for! — but there’s far more to it, and it’s getting harder. Response rates are down, more and more of our lives revolve around cell phones and the internet instead of landlines, and significant swaths of the electorate are re-aligning themselves in surprising ways. Underestimating Trump twice in a row should provoke a lot of soul-searching among pollsters, especially since the early indications are that these issues are going to get worse instead of better. I don’t think the “tried-and-true” techniques that pollsters have used for the last several decades are going to work as well anymore; the ones that want to stay relevant are going to have to get increasingly clever — and careful — with their techniques.
-
Or it could be that Trump supporters are growing more isolated, exactly what is causing what here is not totally clear to me. ↩
-
For instance, cancelling candidate appearances in the state, eliminating ad spend, and/or shifting get-out-the-vote efforts. ↩
-
For example, between September and November 2020 Ipsos ran six polls of the 2020 presidential race in Wisconsin (tracked by fivethirtyeight. All of these polls use nearly identical numbers of respondents, the same questions, the same demographic sampling, and the same turnout models. ↩