Political Polling Part 2: Demographics
This post is part of a series on political polling. To start at the beginning, click here. The code used to generate the charts in this post can be found here.
In the previous post I simulated an electorate as though every person in it was essentially the same. That was useful to show the effects of statistical sampling, but the real world works differently: different demographic groups vary in their candidate preference, turnout likelihood, and even in how they interact with polls.
For example, it’s a pretty well known phenomenon that older people, all else being equal, are more likely to vote. You could imagine that shift might look something like this:
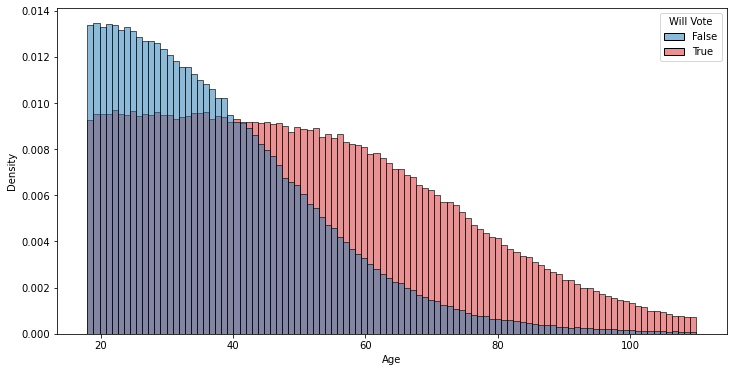
Here, while the total number of potential voters at a given age decreases since older people are more likely to die, the fraction of actual voters declines at a slower rate since the voting likelihood partially counteracts the effects of aging. Similarly, it’s also true that younger people generally tend to support Democratic candidates more than Republicans, which might look like this:
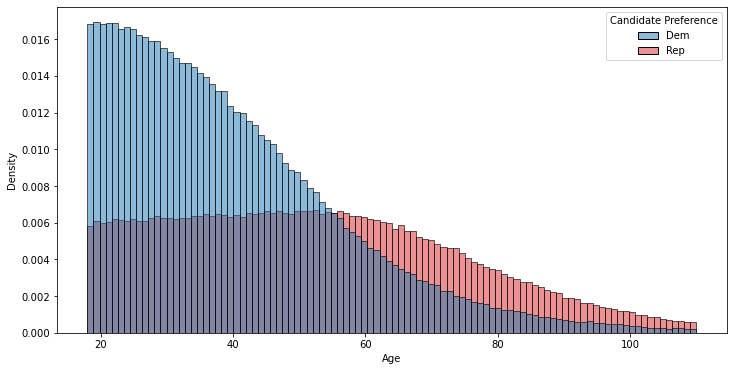
Most demographics are categories — gender, education, voter registration status, etc — and are pretty easy to segment the population by. For continuous demographics like age, however, pollsters generally bucket the population into a few larger segments1. So the prior plot, for the pollster’s purposes, would end up looking something like this:
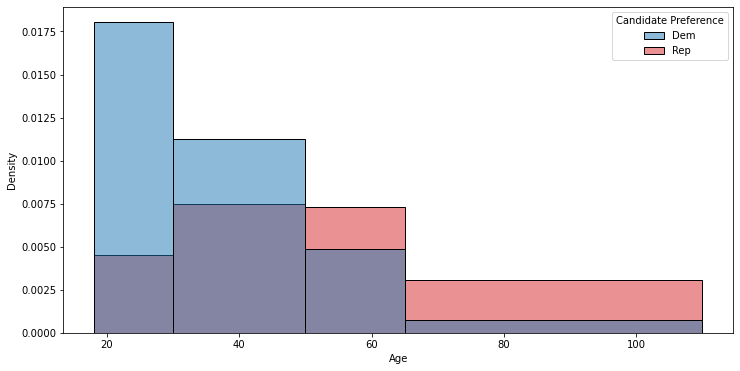
Demographic differences matter greatly for polls. If you don’t correctly consider the demographics of the population, at best your polls will have larger uncertainties than you expect, and at worst you can get polls that give you wildly wrong answers. I’ll dive into some examples of this in the next posts.
-
The reason for this is the same sampling uncertainty from the prior post: if you try to treat every different age as its own demographic you’ll quickly end up with only one or two respondents per age, and your poll will be seriously unreliable ↩